Executive Summary:
Higher-end sales (above $3 million) surged in the second quarter to last year’s historical peaks.
Home prices remained flat in the second quarter, except in San Francisco and San Mateo.
For-sale inventory growth slowed considerably, especially in San Francisco. Inventory remains at 50 percent of the last housing boom.
Tax reform is likely putting a damper on the market by dragging down sales priced between $1 million and $2 million.
But, what did that mean for the Bay Area housing markets in the second quarter? Below is a list of the top four trends that are worth noting for the quarter.
Higher-end sales surged. While the total number of homes sold in the second quarter trended below last year by about 5 percent, higher-priced sales, above $3 million, surged again bringing second quarter sales in line with last year’s historical peak. Figure 1 illustrates the 4-year trend of sales of homes priced above $3 million. There were in total about 672 sales between April and May compared to 675 sales last year. Note, though, that sales over $3 million declined about 25 percent in the first quarter before rebounding in the second quarter.
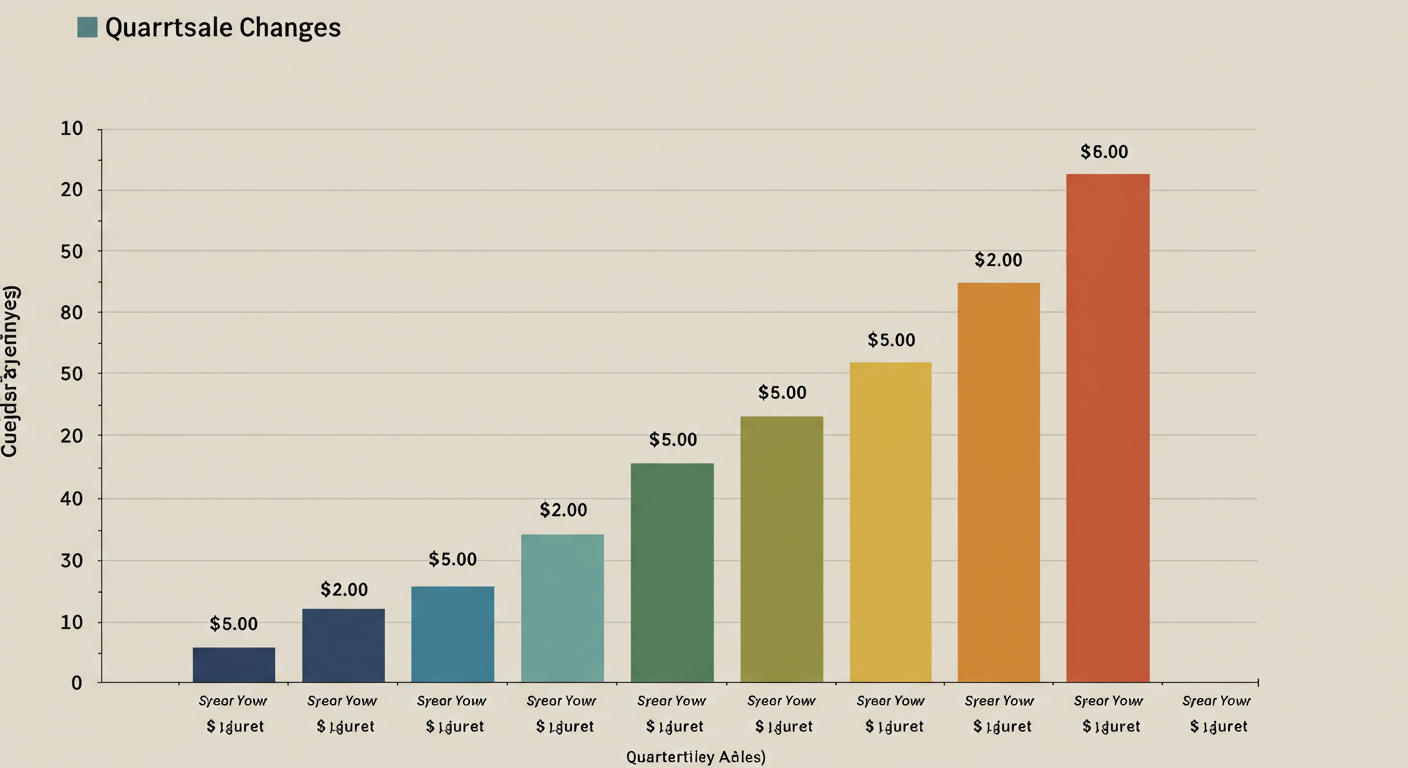
Unlike last year when higher-end sales were popular in Santa Clara and to some extent Sonoma and Contra Costa, this year buyers were more interested in higher-priced homes in Alameda, San Francisco, San Mateo, and Napa. Figure 2 illustrates changes in home sales by price range compared to the second quarter last year.
Out of all homes sold over $3 million, the majority are still in Santa Clara, followed by San Mateo and San Francisco. But Alameda saw a 39 percent jump over last year, followed by a 25 percent jump in Napa, 17 percent in San Mateo and 14 percent in San Francisco. Note that higher-end sales in Alameda still only account for 6 percent of total sales over $3 million.
Figure 1 – 3-month moving average of sales over $3 million
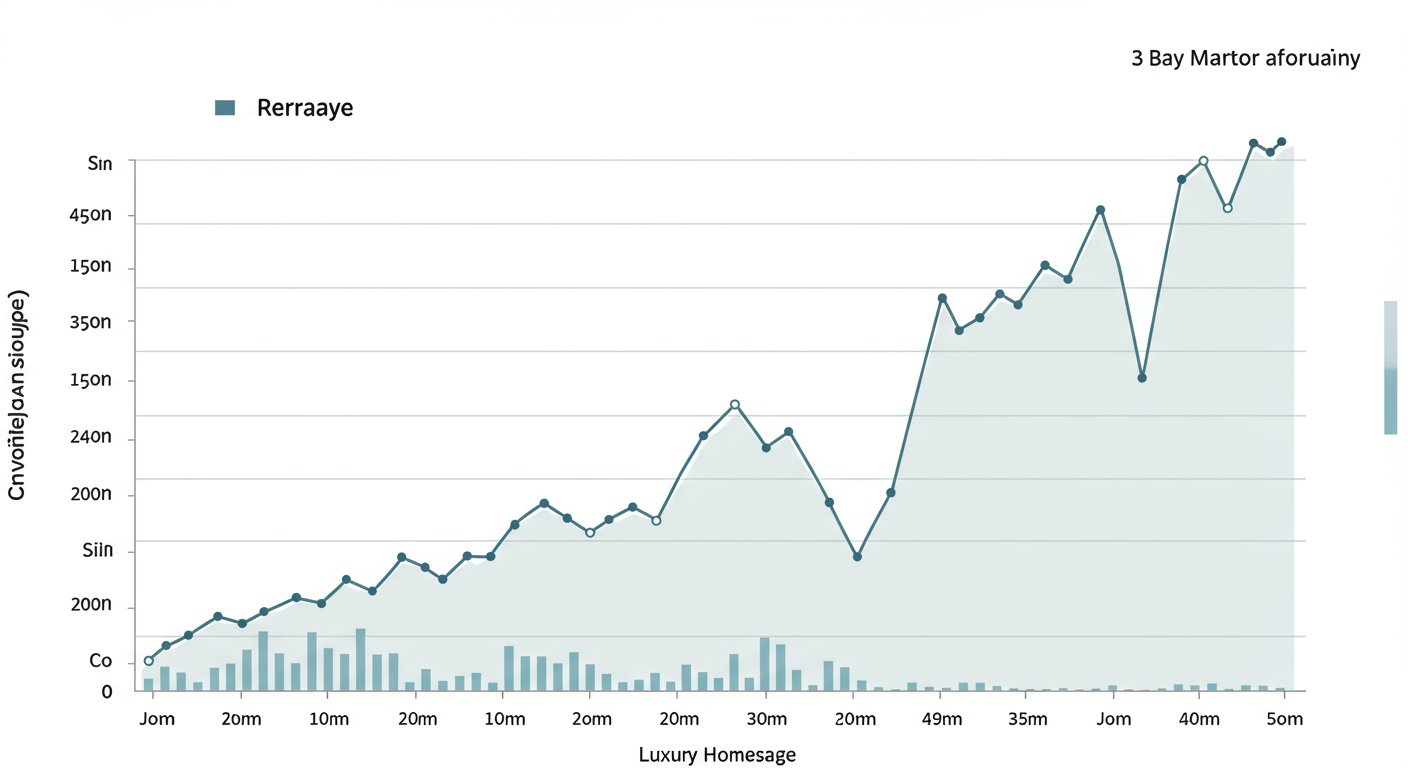
Figure 2 – Quarterly year-over-year change in home sales by price range
- Home prices remained flat in the second quarter, except in San Francisco and San Mateo. As noted in previous analyses, home prices in the Bay Area reached a cyclical high last May when the median price topped at $1 million. Since, the prices followed seasonal declines reaching the lowest point in January and have increased since. Figure 3 illustrates Bay Area median home price trend over the last 3 years, pointing to seasonal highs around May-June and troughs in January. Second quarter 2019 is highlighted in red illustrating flattening of home prices in recent months.
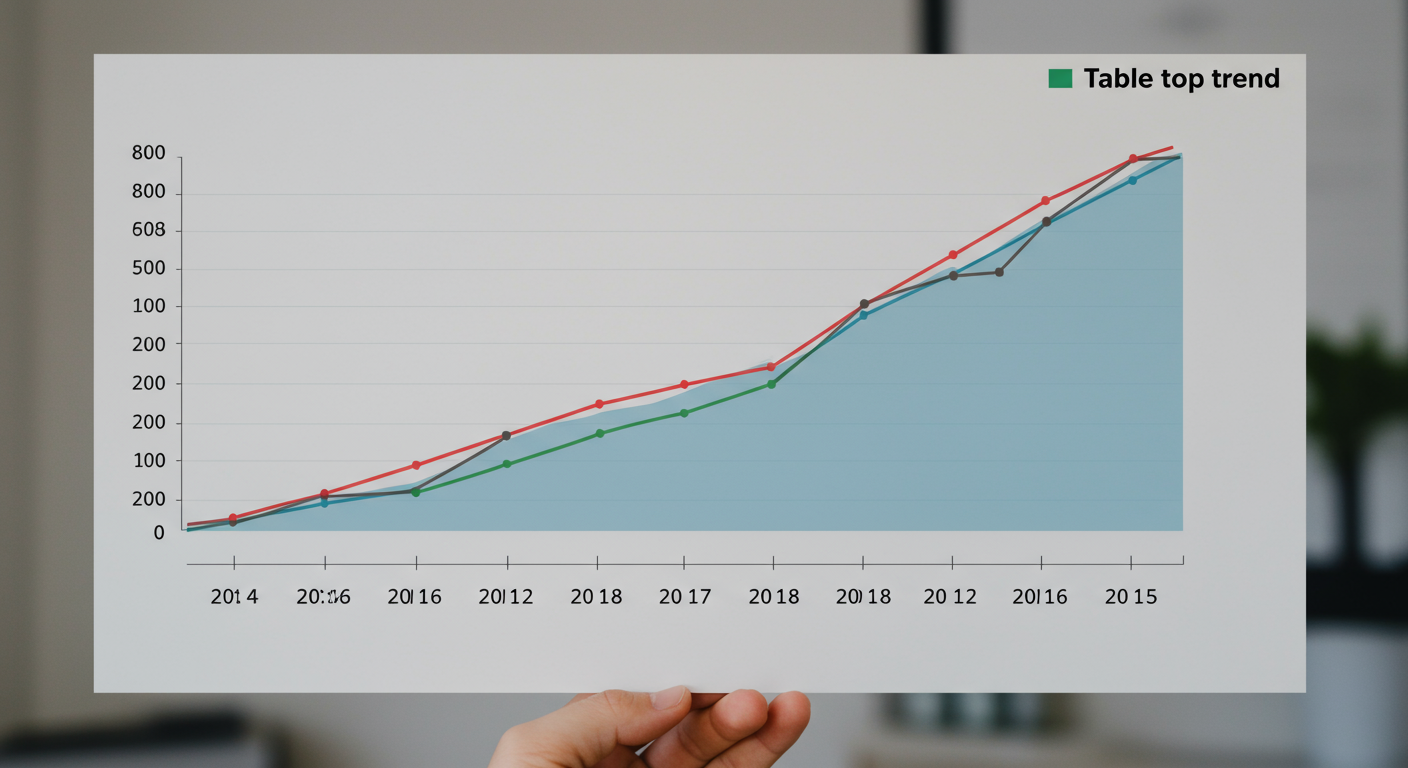
Changes in Table 1 also closely reflect the forecast that was presented at the Pacific Union Real Estate Economic Forecast 2020, illustrated in Figure 4. The forecast called for home prices reaching a “Table Top” in 2019-2020 — when prices reach peaks and remain relatively flat with some slight declines in a few areas. As Figure 4 shows, “Table Top” is much different than the “Mountain Peak” that was experienced during the last housing cycle in 2004 to 2007 when home prices rapidly declined as much as 60 percent following the peak. The reasons prices are expected to remain flat this time around is largely due to exceptionally solid mortgage loan underwriting and a significant share of all-cash purchases, coupled with almost negligible new construction growth. Thus, while it’s inevitable to evoke the 2004-2007 period when thinking about home prices going forward, keep in mind that the last housing cycle was considerably different, driven by demand and supply of low-quality loans and a loosely regulated mortgage system, and excess new construction that was absorbed by speculative buying and highly indebted households. Much has changed since. Today’s mortgage system is well capitalized and follows strict Dodd-Frank reform, new construction is roughly 50 percent below the 2004 period and homeowners have a total of about $5.8 trillion in available home equity, the highest volume ever recorded and 16 percent above the last home price peak in 2006. Further, venture-capital activity remains steadily anchored to the Bay Area region, which will continue fueling local economy going forward.
Figure 3 – Bay Area 8-county median home price trend

Table 1
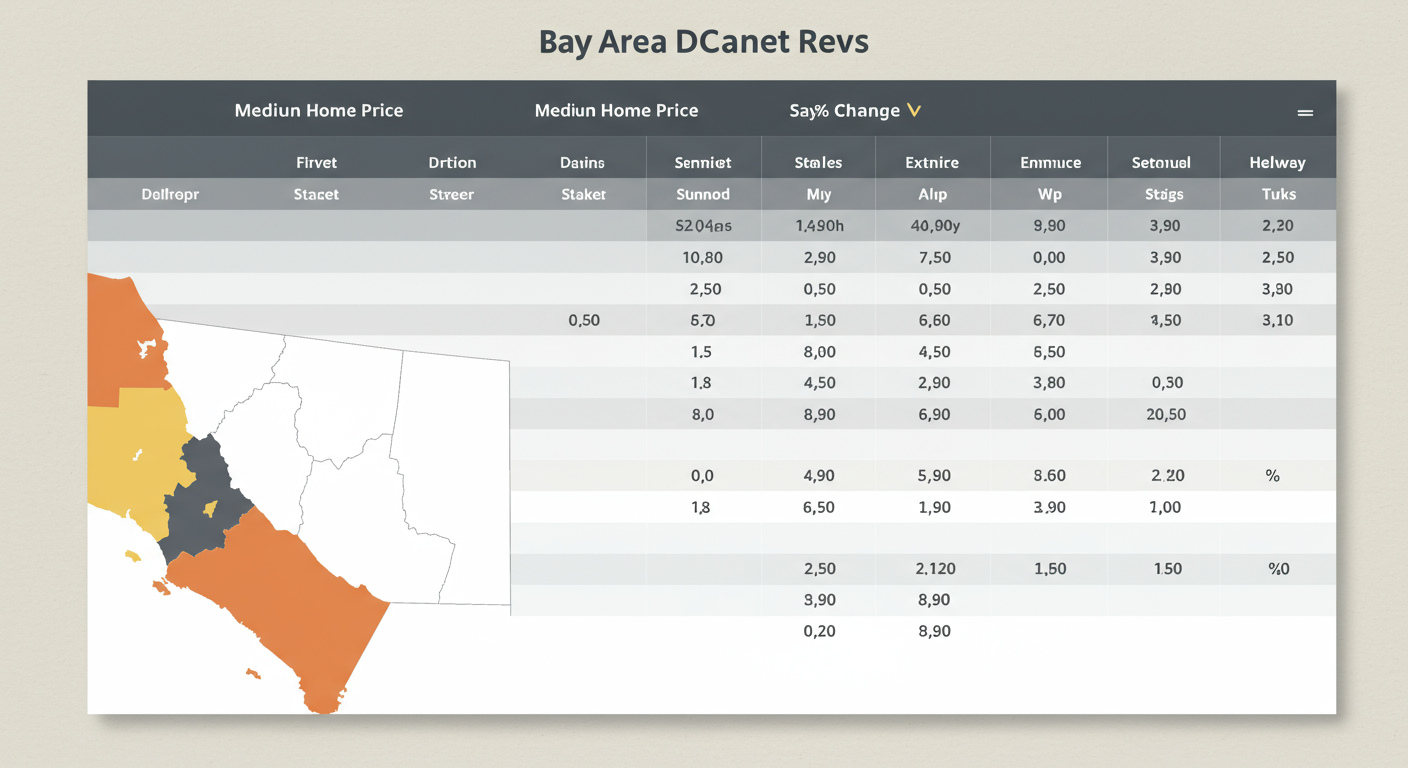
Figure 4 – John Burns Home Value Index Forecast
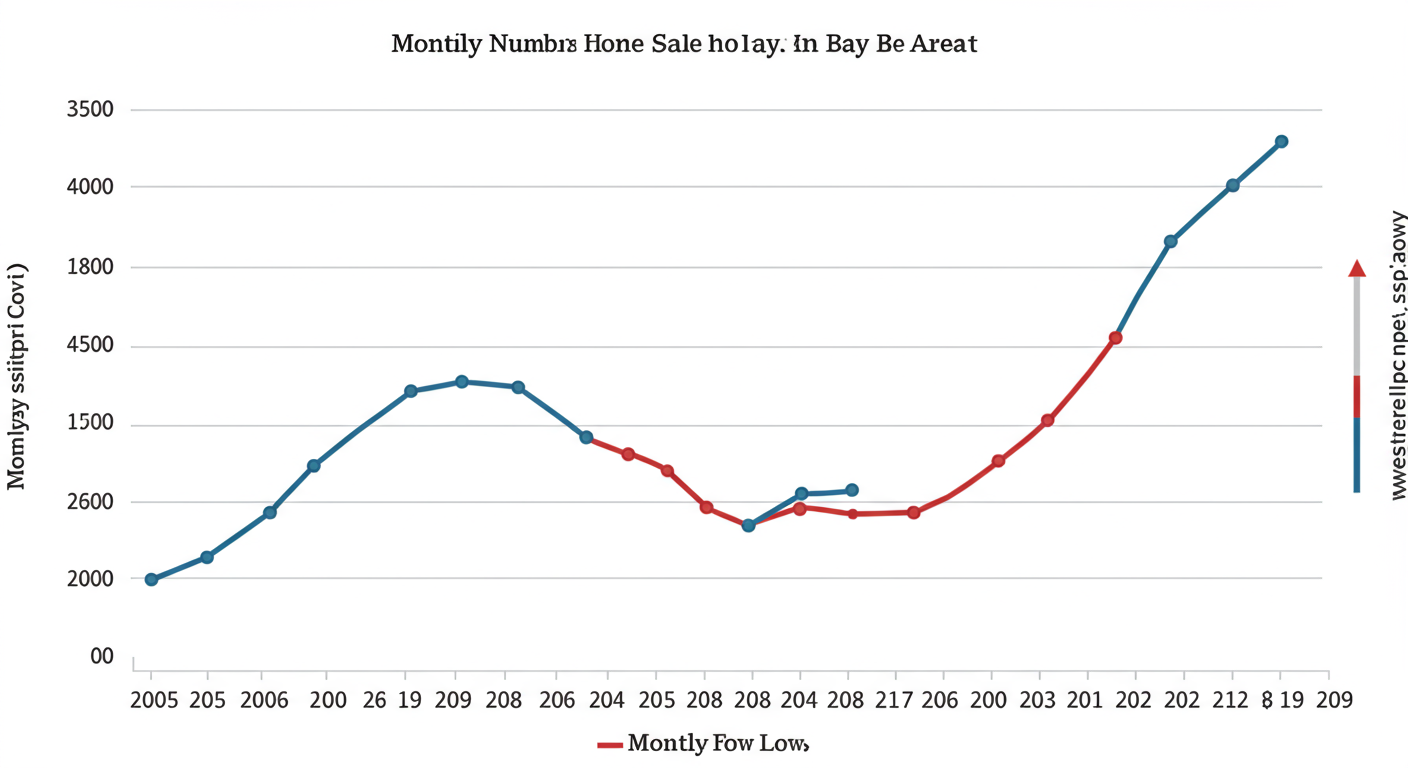
- For-sale inventory growth slowed considerably. While overall inventory is about 11 percent ahead of last year, inventory growth and addition of new listings has slowed, suggesting that acute lack of homes for sale continues to hang over Bay Area housing markets. Figure 5 illustrates availability of homes for sale in the Bay Area’s eight-county region going back to 2005. Since 2012, when much of the for-sale inventory was absorbed, inventory levels dropped to about 50 percent of the levels seen between 2005 and 2010. Continued lack of inventory further supports our forecast of flattened home prices over the next couple of years.
- Lastly, tax reform is likely putting a damper on the market by dragging down sales priced between $1 million and $2 million. While the quarter ended with 5 percent fewer sales than last year, or 876 fewer sales, 84 percent of the decline, or 738 units, was due to fewer homes sold priced between $1 million and $2 million. Table 2 summarizes quarterly year-over-year change by price range.
As discussed at the Pacific Union Real Estate Economic Forecast 2020, tax reform which capped state and local deductions to $10,000, and reduced the mortgage interest deduction of a loan up to $750,000 from the previous $1 million cap, significantly increased the cost of owning a home in California. And in the Bay Area, where homes priced between $1 million and $2 million are not considered luxury homes, households that relied on the deductions to be able to afford a home are having a hard time reconciling the purchase.
Table 2

Going forward, home buyers could be facing an easier time. Mortgage interest rates have eased from their winter highs and may continue to trend lower depending on forthcoming actions of the Federal Reserve. Nevertheless, according to Freddie Mac’s Primary Mortgage Market Survey, the U.S. weekly average 30-year fixed mortgage rate was at3.75 percent this week, already the lowest since January 2018 (Figure 6).
Figure 6 – U.S. weekly average 30-year fixed mortgage rate